November 10th, 2025
What is Multivariate Analysis? Types, Use Cases, and Examples
By Drew Hahn · 7 min read

Many teams measure performance across multiple dashboards but still miss how their metrics interact. I’ve used multivariate analysis to reveal which variables move together and why those relationships matter. Here’s a clear breakdown of what it is, how it works, and where it creates real impact.
What is multivariate analysis?
Multivariate analysis is a statistical approach used to study several variables at the same time to understand how they interact and affect performance. It helps reveal patterns and relationships that simpler analyses can miss, showing how multiple factors work together to shape results.
I’ve used it to identify which campaign elements drive conversions, analyzing audience type, ad format, and spend together to see which combinations deliver the strongest performance.
Why multivariate analysis matters
Multivariate analysis matters because many business or research problems involve several factors acting together. It shows how variables work together to shape results.

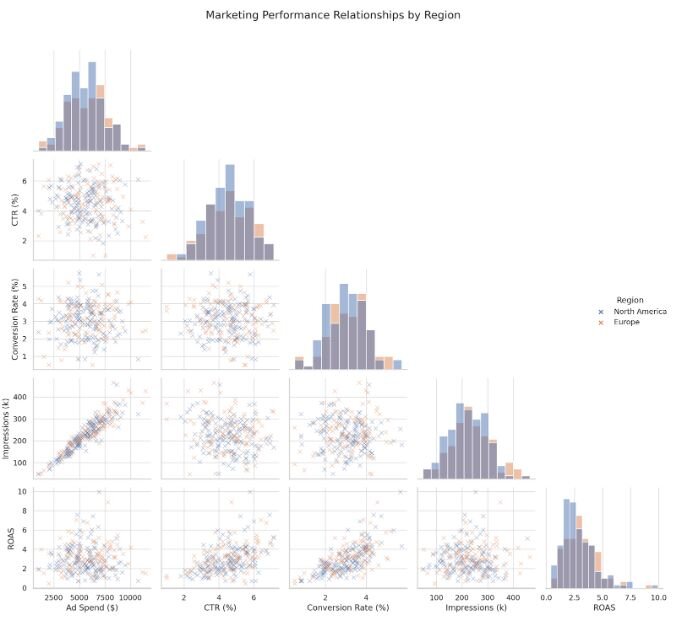
This chart shows multivariate analysis in action, comparing how ad spend, CTR, conversion rate, impressions, and ROAS relate across North America and Europe. It reveals how marketing metrics move together, helping teams identify the patterns that drive stronger performance.
When you look at just one variable, it’s hard to spot anything meaningful. But when you see them together, patterns start to appear. You can tell, for instance, that higher calorie intake often goes hand in hand with higher obesity levels, and that activity levels shift with age and gender.
I use multivariate analysis the same way to connect relationships across business data. It shows how different factors combine to influence results, whether that’s customer behavior, campaign performance, or market trends.
Key techniques in multivariate analysis
The method you choose depends on what you want to learn from your data. Some techniques focus on prediction, while others uncover patterns or group relationships. Here are the main multivariate techniques to know:
Multiple regression: Estimates how independent variables, such as ad spend, audience size, and product price, collectively affect a single outcome like sales. It’s one of the most common approaches in marketing and economics.
Correlation analysis: Measures how strongly two variables move together. While it’s technically a bivariate method, it’s often the first step before multivariate modeling because it helps identify which variables are worth including in deeper analyses.
Logistic regression: Predicts binary outcomes, such as whether a customer will buy or not buy, based on several predictors like demographics and engagement.
MANOVA (Multivariate Analysis of Variance): Tests how multiple independent factors affect more than one dependent outcome. For example, it can show how store location and promotion type together impact both sales and satisfaction.
Factor analysis: Groups related variables into categories to reduce complexity. It’s often used in surveys to uncover underlying themes, such as how people rate brand quality, trust, and satisfaction.
Cluster analysis: Groups customers or markets with similar characteristics or behavior patterns. In marketing, this method helps identify audience segments that react alike to certain offers, messages, or pricing.
Conjoint analysis: Studies how consumers make trade-offs between features or prices to determine which combinations deliver the most perceived value.
Use cases: Multivariate analysis examples
Multivariate analysis helps businesses uncover how different factors work together to influence results. Here are some of its use cases:
Marketing
Finance
In finance, multivariate analysis helps measure how several factors influence risk and return together. I’ve seen analysts use it to model how interest rates, inflation, and portfolio diversification affect portfolio performance over time. Many teams rely on financial analysis software that combines methods like multiple regression and factor analysis to explore how these variables interact during market shifts.
Operations
Operations teams use multivariate analysis to find the most efficient balance between resources, quality, and cost. I’ve worked with data showing how staffing levels, shift schedules, and equipment uptime interact to impact productivity. When combined with reliability analysis, it highlights which process adjustments improve consistency and reduce downtime.
Product and customer research
Human resources and workforce planning
HR professionals use multivariate analysis to connect employee engagement, experience, and performance data. For example, one model I built combined training hours, tenure, and satisfaction scores to predict turnover risk. This type of analysis offers deeper insight than univariate analysis, which reviews each factor separately and can miss important relationships.
Healthcare and social research
How to conduct multivariate analysis
Running a multivariate analysis follows a clear process. Here’s how to do it:
Define your question: Start with a specific outcome you want to understand. For example, you might want to know how pricing, ad spend, and audience type influence sales or conversions.
Collect and clean data: Gather data from all relevant sources, such as sales platforms, ad dashboards, or customer surveys. Remove duplicates, fill missing values, and make sure variables use consistent formats.
Select your variables: Identify dependent variables (what you want to predict) and independent variables (factors that might affect it). Clear labeling helps prevent confusion later when interpreting results.
Choose your method: Select the right technique for your goal. Regression methods work well for prediction, while factor or cluster analysis helps uncover relationships and patterns.
Run the analysis: Use your chosen platform or tool to process the data. Julius connects directly to your data sources and can run analyses in plain language, which saves time and reduces the need for manual coding.
Interpret results: Review how variables interact and look for meaningful patterns. Focus on relationships that can guide action, such as which combination of factors drives the strongest outcome.
Benefits and limitations of multivariate analysis
Multivariate analysis gives analysts and decision-makers a clearer view of how multiple variables work together. It goes beyond single-variable methods to explain complex relationships and predict outcomes more accurately. Below are some key benefits and limitations to consider:
Benefits
When used correctly, multivariate techniques help uncover deeper patterns in data and provide insights that would be hard to find otherwise. Here are some of its benefits:
Comprehensive view: Shows how several factors interact at once instead of isolating them.
Better predictions: Improves forecasting accuracy by modeling real-world complexity.
Deeper insight: Reveals hidden relationships between variables that single-variable analysis might overlook.
Efficiency: Reduces the need for separate analyses across related variables.
Decision support: Helps teams focus on the combinations of factors that actually drive results.
Limitations
Despite its strengths, multivariate analysis also comes with challenges that require careful setup and interpretation. These are the limitations you may run into:
Complex data preparation: Requires clean, structured datasets with compatible variables.
Higher computation demand: Processing multiple variables at once can be resource-intensive. Interpretation risk: Results can be misleading if variables are poorly chosen or correlated.
Best practices for reliable results
Following a few simple habits helps keep your multivariate analysis consistent and actionable. Here are the key practices to follow:
Check assumptions: Confirm your variables are independent, properly scaled, and free of missing or inconsistent data.
Validate your model: Test the model with new data or across different time ranges to see if results hold up under real conditions.
Combine visuals and context: Use charts or dashboards to show relationships clearly and connect statistical findings to real-world meaning.
These practices make results more dependable and easier to explain, especially when sharing insights across teams.
How Julius can help with multivariate analysis
Multivariate analysis can be complex when you’re switching between tools or running separate models for every variable. Julius makes it simple by letting you explore relationships, run tests, and visualize patterns across multiple data sources using natural language.
Here’s how Julius helps with multivariate analysis and beyond:
Quick single-metric checks: Ask for an average, spread, or distribution, and Julius shows you the numbers with an easy-to-read chart.
Built-in visualization: Get histograms, box plots, and bar charts on the spot instead of jumping into another tool to build them.
Catch outliers early: Julius highlights values that throw off your results, so decisions rest on clean data.
Recurring summaries: Schedule analyses like weekly revenue or delivery time at the 95th percentile and receive them automatically by email or Slack.
Smarter over time: With each query, Julius gets better at understanding how your connected data is organized. That means it can find the right tables and relationships faster, so the answers you see become quicker and more precise the more you use it.
One-click sharing: Turn a thread of analysis into a PDF report you can pass along without extra formatting.
Direct connections: Link your databases and files so results come from live data, not stale spreadsheets.
Ready to see how Julius can help you interpret complex relationships in your
Frequently asked questions
How Julius can help with multivariate analysis
Multivariate means analyzing three or more variables at once to understand how they interact and affect results. It’s used when several factors combine to influence one outcome, such as how pricing, promotion, and seasonality impact sales.
What is the difference between univariate vs multivariate analysis?
The key difference between univariate vs multivariate analysis is the number of variables studied. Univariate analysis looks at one variable at a time, while multivariate analysis examines several variables together to reveal patterns and relationships.
What are common techniques used in multivariate analysis?
The main techniques include multiple regression, logistic regression, MANOVA, factor analysis, cluster analysis, and conjoint analysis. Each helps explore relationships, predict outcomes, or group related variables.
When should you use multivariate analysis?
Use multivariate analysis when several variables influence an outcome and you need to understand how they interact. It’s ideal for business, marketing, finance, and research, where data has multiple contributing factors.
What is an example of multivariate analysis in business?
A classic business example is predicting sales by analyzing pricing, advertising spend, and seasonality together. This helps identify which mix of factors drives the strongest results, instead of examining each variable on its own.
