September 26th, 2025
Reliability Analysis in Research: Assumptions and Reporting
By Rahul Sonwalkar · 8 min read

Reliability analysis shows whether your results hold steady when you measure the same thing more than once. A customer survey, for example, should give stable responses if you repeat them a week later, and a job skills test should return consistent scores even when graded by different people.
In this article, we’ll cover:
What is a reliability analysis?
Methods of reliability analysis
Assumptions to check
How to run a reliability analysis
Limitations of reliability analyses
What is a reliability analysis?
Reliability analysis is the process of testing whether a research tool produces consistent results under the same conditions. It shows whether a survey, questionnaire, or test gives similar outcomes when repeated. Unlike validity, which tells you if you’re measuring the right thing, reliability tells you if you’d get the same result again.
I’ve seen this in customer feedback surveys where repeating the same brand perception questions a week later produced nearly identical scores. That showed me the survey was reliable. In another case, I ran an ad recall test twice with the same group, but the answers were very different. That was a clear sign of weak reliability, since the results didn’t hold steady under the same conditions.
Consequences of low reliability
Low reliability means your data isn’t trustworthy and can cause real problems when you try to act on your results. I’ve seen projects where findings looked solid at first, but once we checked reliability, it was clear the conclusions were shaky.
Here are some common outcomes:
Survey reliability issues: Inconsistent tracking of customer insights can lead to bad product choices. I reviewed a brand survey that first suggested customers cared more about price than quality, but when we ran it again with the same group, the answers flipped. That showed the survey wasn’t reliable, and the company only avoided a mistake because we caught it in time.
Reliability problems in academics: Unreliable scales can invalidate whole studies. If a psychological scale gives different results from the same group within a short period, the conclusions lose credibility.
Gaps in engineering and QA: Inconsistent product testing can hide defect rates. A test that doesn’t produce the same results each time may suggest products are safe when, in reality, problems only appear on repeat runs.
The risks of low reliability are serious, so it’s important to measure consistency directly. Researchers and analysts use different methods depending on the type of data and study design.
Methods of reliability analysis
Test-retest reliability
Test-retest reliability shows whether the same measure produces stable results over time. You give the same test to the same group at two different points and then check the correlation between scores.
I’ve done this with A/B testing, where I ran the same creative effectiveness survey twice with the same audience. When the scores lined up, I knew the tool was reliable. The challenge is timing, because if you wait too long, genuine changes in behavior can skew the numbers.
Internal consistency
Internal consistency looks at how well items on a survey or test measure the same idea. The most common way to check this is with Cronbach’s alpha, a statistic widely used to measure internal consistency.
In most cases, a score of 0.7 or higher is seen as an acceptable level of consistency. I’ve used this when checking multi-question brand loyalty surveys. A strong alpha showed that all the items reflected one idea, not separate constructs.
Split-half reliability
Split-half reliability divides test items into two groups and checks how closely the results match. It gives a quick read on whether items measure the same concept, but the outcome can shift because it only looks at one split at a time. Researchers often adjust this estimate with the Spearman-Brown formula, which predicts how reliable the full test would be.
Cronbach’s alpha is a reliability statistic that expands on this idea by considering all possible splits, which provides a more complete picture. It works best when all items measure a single construct.
Inter-rater reliability
Inter-rater reliability looks at how closely different people agree when they evaluate the same thing. In marketing, this might be two moderators scoring the persuasiveness of ad messages in a focus group. The level of agreement is often checked with reliability statistics like Cohen’s kappa or the intraclass correlation coefficient (ICC).
When the scores are close, it shows the raters are applying the criteria in the same way. Bigger gaps can mean the scoring guidelines need to be clearer.
Parallel forms reliability
Parallel forms reliability checks whether two versions of the same test or survey give similar results. The versions should measure the same concepts and be equivalent in difficulty, which also means the scores should line up not just in correlation but in average level and spread.
I’ve done this with product feedback surveys by creating two sets of questions that asked about the same ideas in different ways. To confirm reliability, I compared the results using a correlation coefficient like Pearson’s correlation coefficient. When the scores matched closely, it showed the survey was reliable.How to choose the right reliability analysis method for marketing research
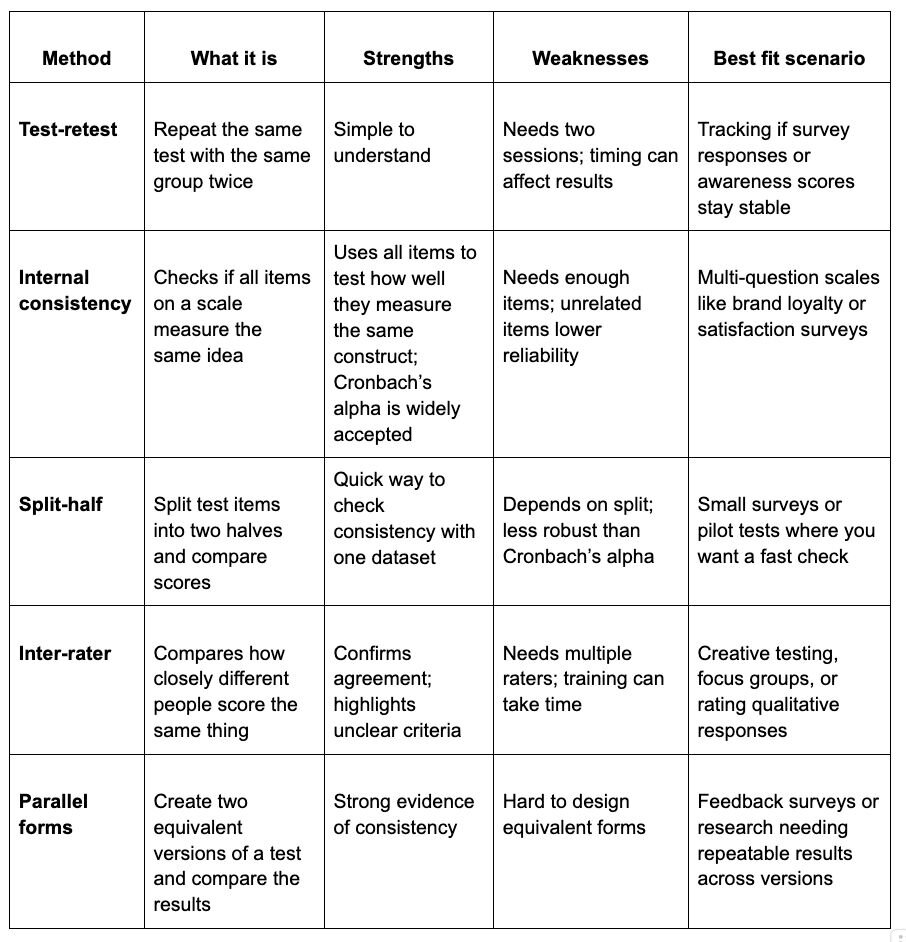
I’ve used different approaches depending on the data I was working with, and each one came with tradeoffs. Some methods are quick checks, while others dig deeper but need more effort. Here’s a breakdown you can use when deciding which method fits your project:

Assumptions to check before performing a reliability analysis
Before you run reliability analysis, you need to make sure a few basic conditions are in place. Here are the assumptions to review first:
Items measure one construct: All the questions or test items should measure the same underlying construct. For example, if you’re building a brand loyalty scale, every item should reflect loyalty. Adding unrelated ideas like pricing would weaken the measure.
Sample size considerations: Larger samples produce more stable reliability estimates. Very small samples can show high reliability by accident, but those results often don’t hold up with larger groups.
Errors uncorrelated: For measures like Cronbach’s alpha, error terms across items should be independent. If items are too similar in wording or content, they could correlate for the wrong reason and inflate the reliability estimate.
How to run a reliability analysis with Julius
Julius is a no-code data analysis platform that lets you run advanced checks like a reliability analysis without having a statistics degree. Instead of writing formulas or scripts, you can load your dataset, ask questions in natural English, and get results with explanations and visuals.
Here’s a simple workflow that keeps things clear and repeatable:
Load your dataset: Connect Julius to your source (CSV, database, warehouse, or API) or upload a file. Julius reads your columns and lets you pick the items or ratings you want to test.
Ask Julius in plain language: Type a request like “Run Cronbach’s alpha on the customer satisfaction scale” or “Check inter-rater agreement for evaluator scores.” Julius parses that prompt, sets up the checks (with your confirmation), and gets ready to run the analysis.
Review outputs: Julius can return internal consistency measures such as Cronbach’s alpha and support analyses like inter-rater agreement or ICC through queries and workflows. You’ll also see short explanations of what the values mean, and optional visuals like item correlation matrices, rater agreement charts, or split comparisons.
Clean and re-run if needed: Julius includes options for handling missing values, removing duplicates, and spotting unusual values, so you can improve data quality before running the analysis again.
Save and share the report: Save your workflow in a Notebook so you can rerun it with new data. Export the output as PDF, CSV, or PNG, or share it directly via email or Slack.
Julius helps reduce the setup time of reliability analysis compared to manual scripting tools. Our aim is to make reliability analysis easy for you to repeat across studies.
Bonus tip: How to report reliability results
Once you’ve run the numbers, the next step is sharing them in a way that fits your audience.
Business readers usually prefer plain-language summaries, while academic work requires formal reporting. Here are a few examples of reporting statements you can make to clearly present the results:Stakeholder-friendly version
“Our survey items are consistent enough to trust the results.”
This type of phrasing works well when you’re presenting to managers, clients, or teammates who don’t need the technical detail. It focuses on the takeaway that the data can be trusted, without overwhelming the reader with statistics. You can use this in a presentation deck, a summary report, or even a quick Slack update.APA-style statement
“Cronbach’s alpha = 0.82, N = 120, indicating strong internal consistency.”
This format follows APA guidelines and is often expected in research reports, academic papers, or professional publications. The statistic (Cronbach’s alpha) shows internal consistency, while the sample size (N = 120) makes the result more transparent.
A score of 0.82 indicates that the items in the scale measured the same idea reliably. If your audience is familiar with statistics, this format gives them confidence in your results.
Dissertation/thesis version
“The reliability of the customer satisfaction scale was assessed using Cronbach’s alpha. The analysis produced a coefficient of 0.82, suggesting that the items consistently measured the same construct across participants.”
This version gives the most detail, weaving the statistic into a full sentence so it reads smoothly in long-form writing. It’s the right choice for theses, dissertations, or technical documentation where readers expect context alongside the number. It not only reports the result but also explains what it means for the study.
How Julius can help with reliability analysis and more
Reliability analysis is a key factor in making sure your research is credible, but running the calculations manually can slow you down. With Julius, you can check reliability by asking questions in plain English instead of writing formulas or wrestling with clunky menus.
We designed Julius to give you speed and clarity, so you can focus on what the numbers mean instead of the setup.
Here’s how it helps with reliability analysis and beyond:
Automated checks: Run internal consistency tests like Cronbach’s alpha without coding. For other methods, such as inter-rater or split-half reliability, Julius helps prep and analyze results through queries and repeatable workflows.
Data cleaning support: Handle missing values, duplicates, or outliers inside Julius before running your analysis, so your reliability results stay accurate.
Instant visuals: Turn outputs into charts and tables that are ready to share with your team.
Repeatable workflows: Use Notebooks to schedule and re-run the same analysis across different datasets.
Ready to see how Julius can get you insights faster? Try Julius for free today.
